
About Me:
Projects:
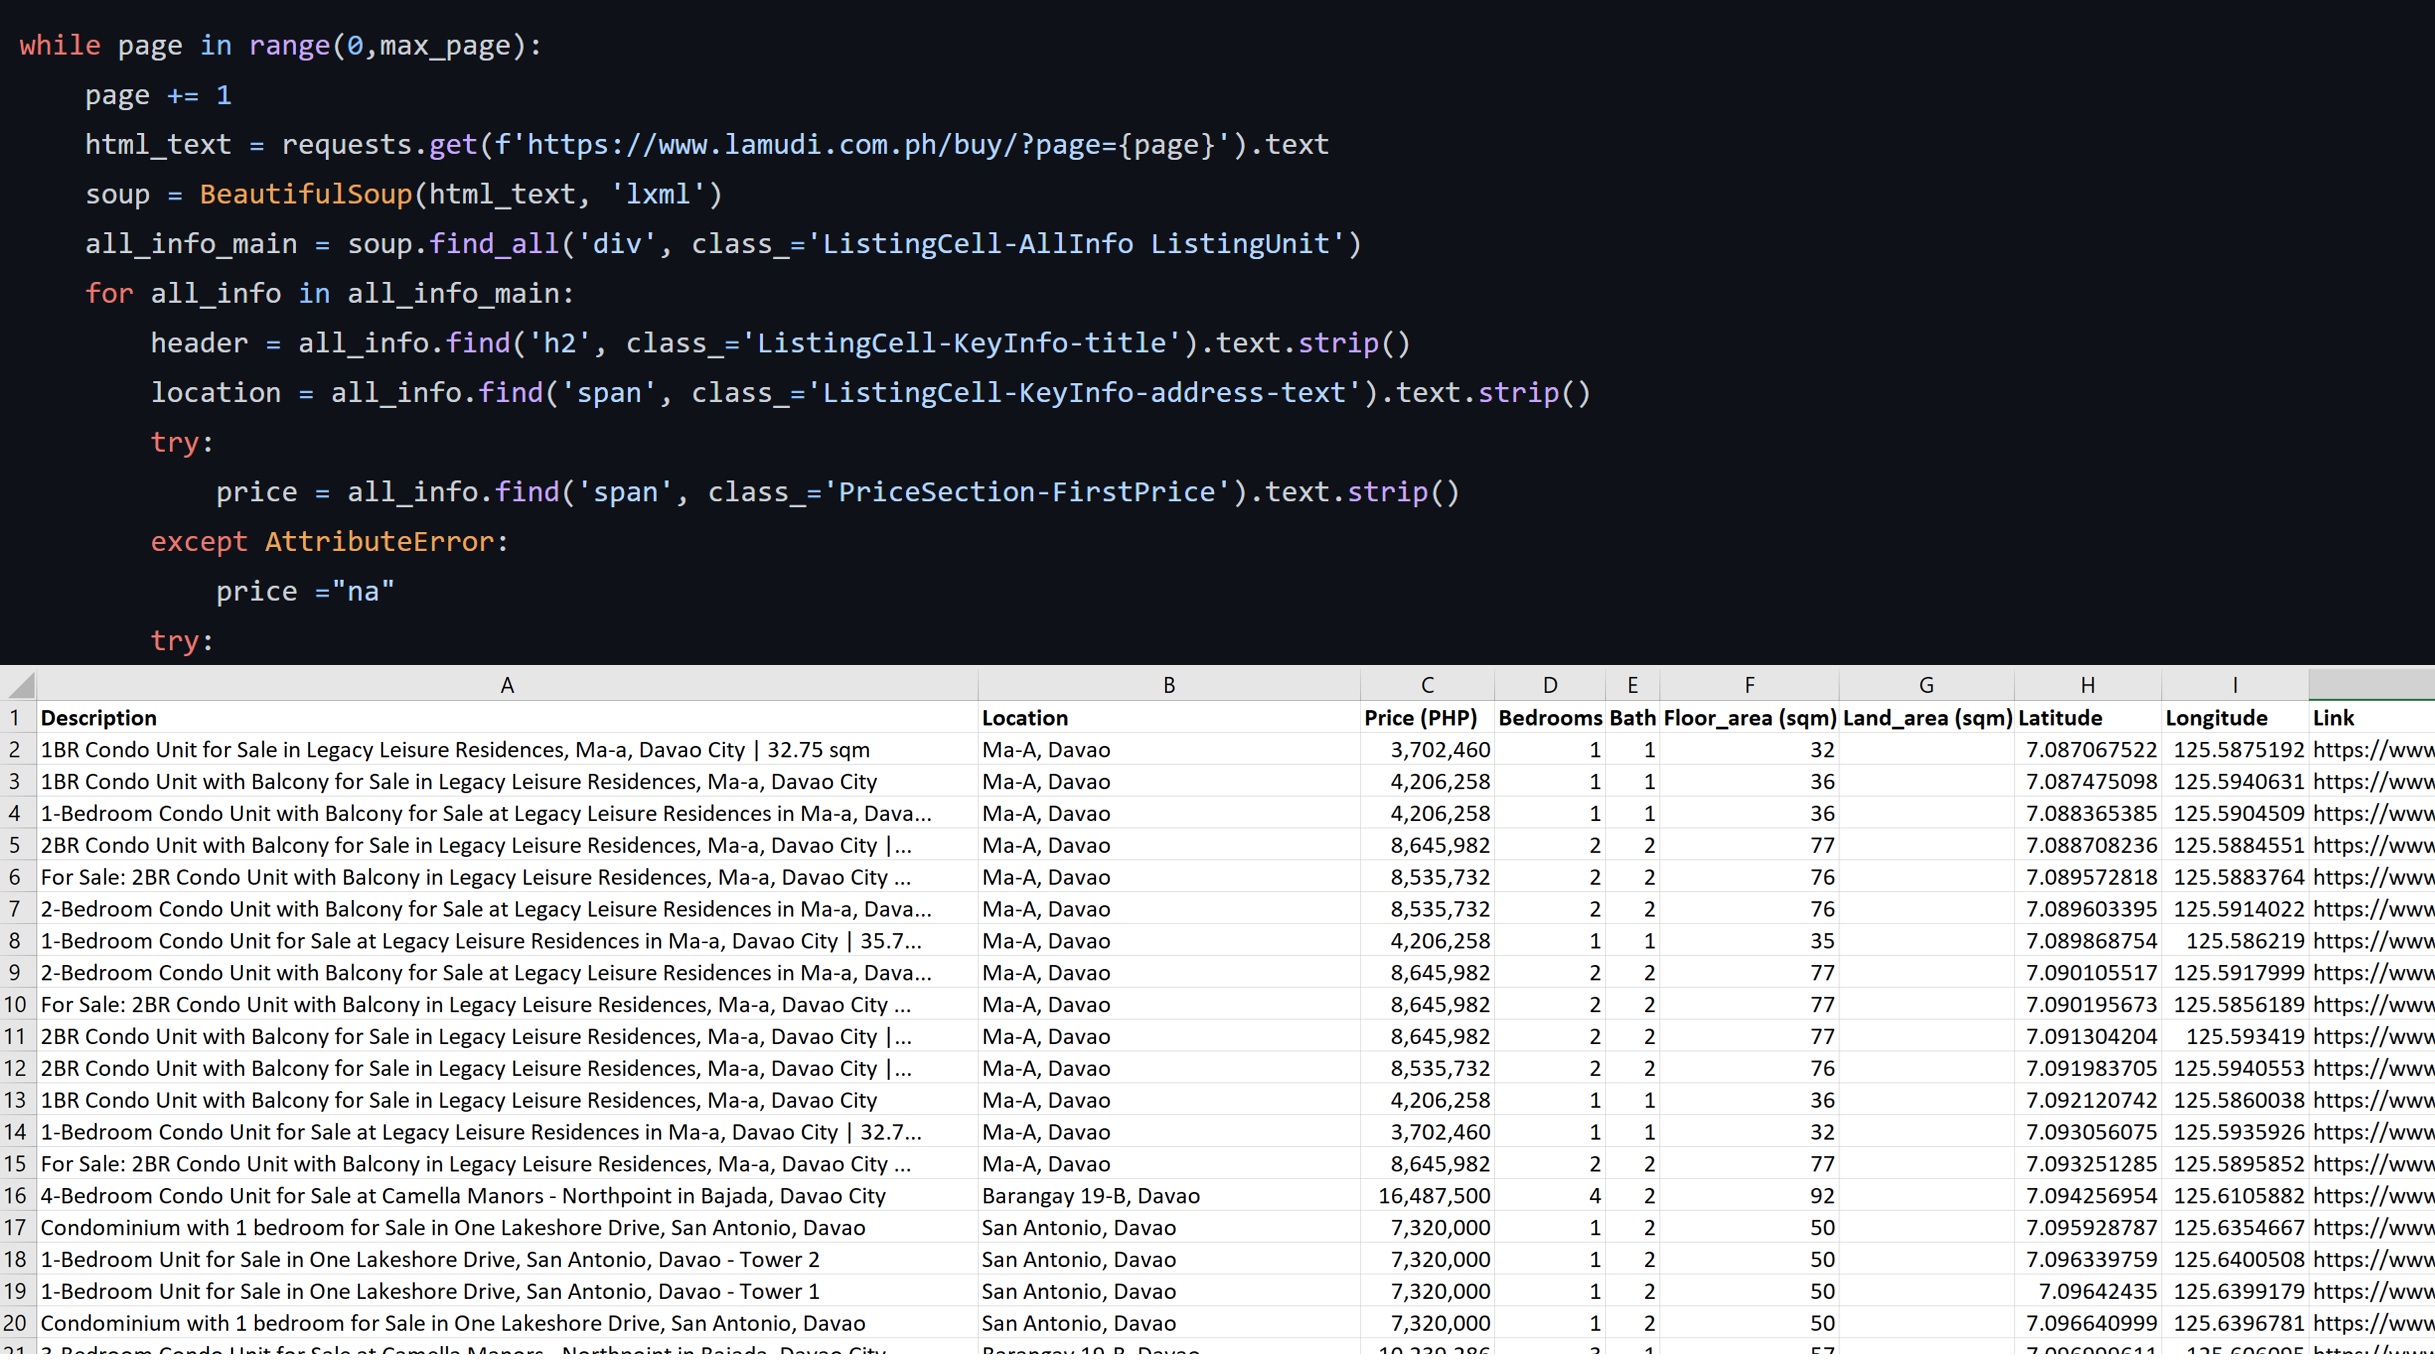
Web Scraping via Python + BS4
Using Python & the BS4 package (Beautiful Soup 4), I have extracted Philippine housing data from a real estate website and have exported it to excel for macro analysis purposes
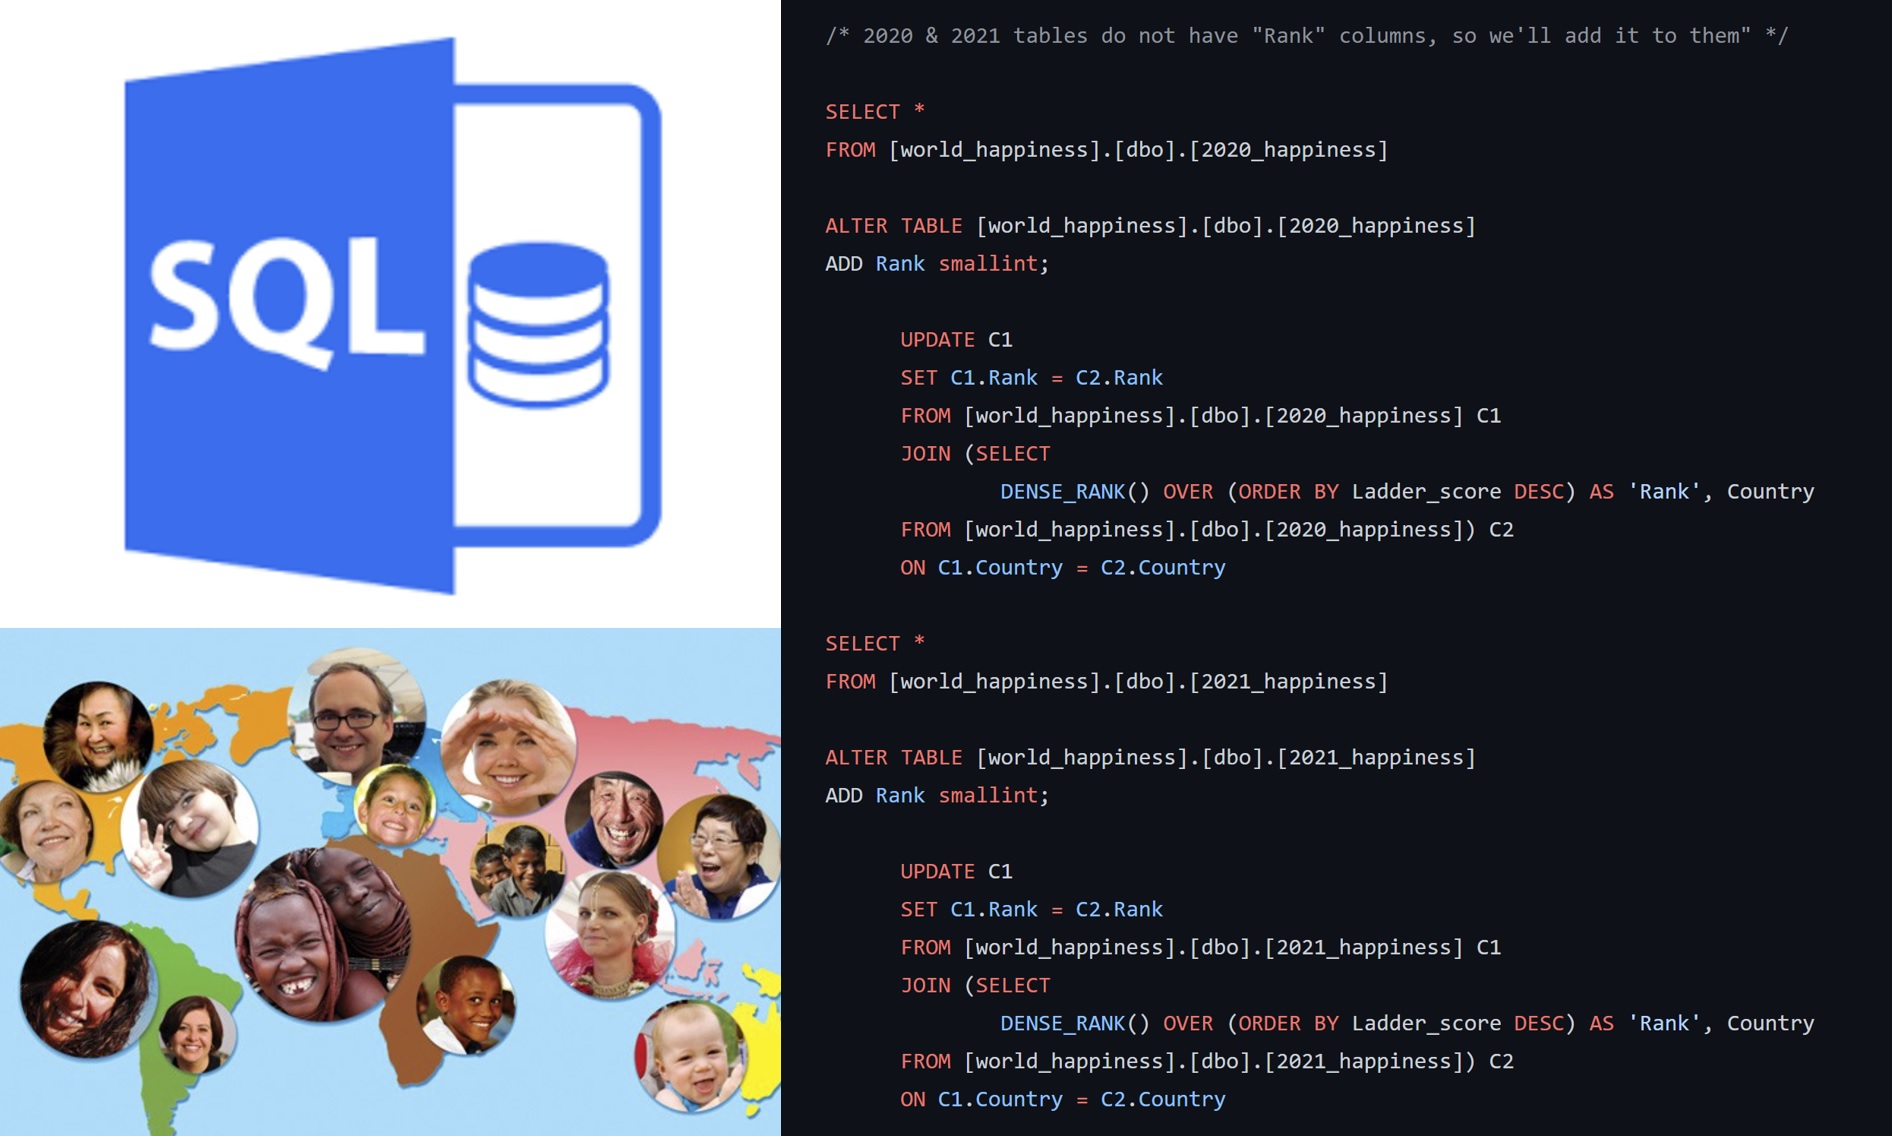
World Happiness Data Analysis using SQL
Using SQL for data cleaning, feature engineering & compiling world happiness data from 2015 to 2021, to look into which countries improved and degraded the most.
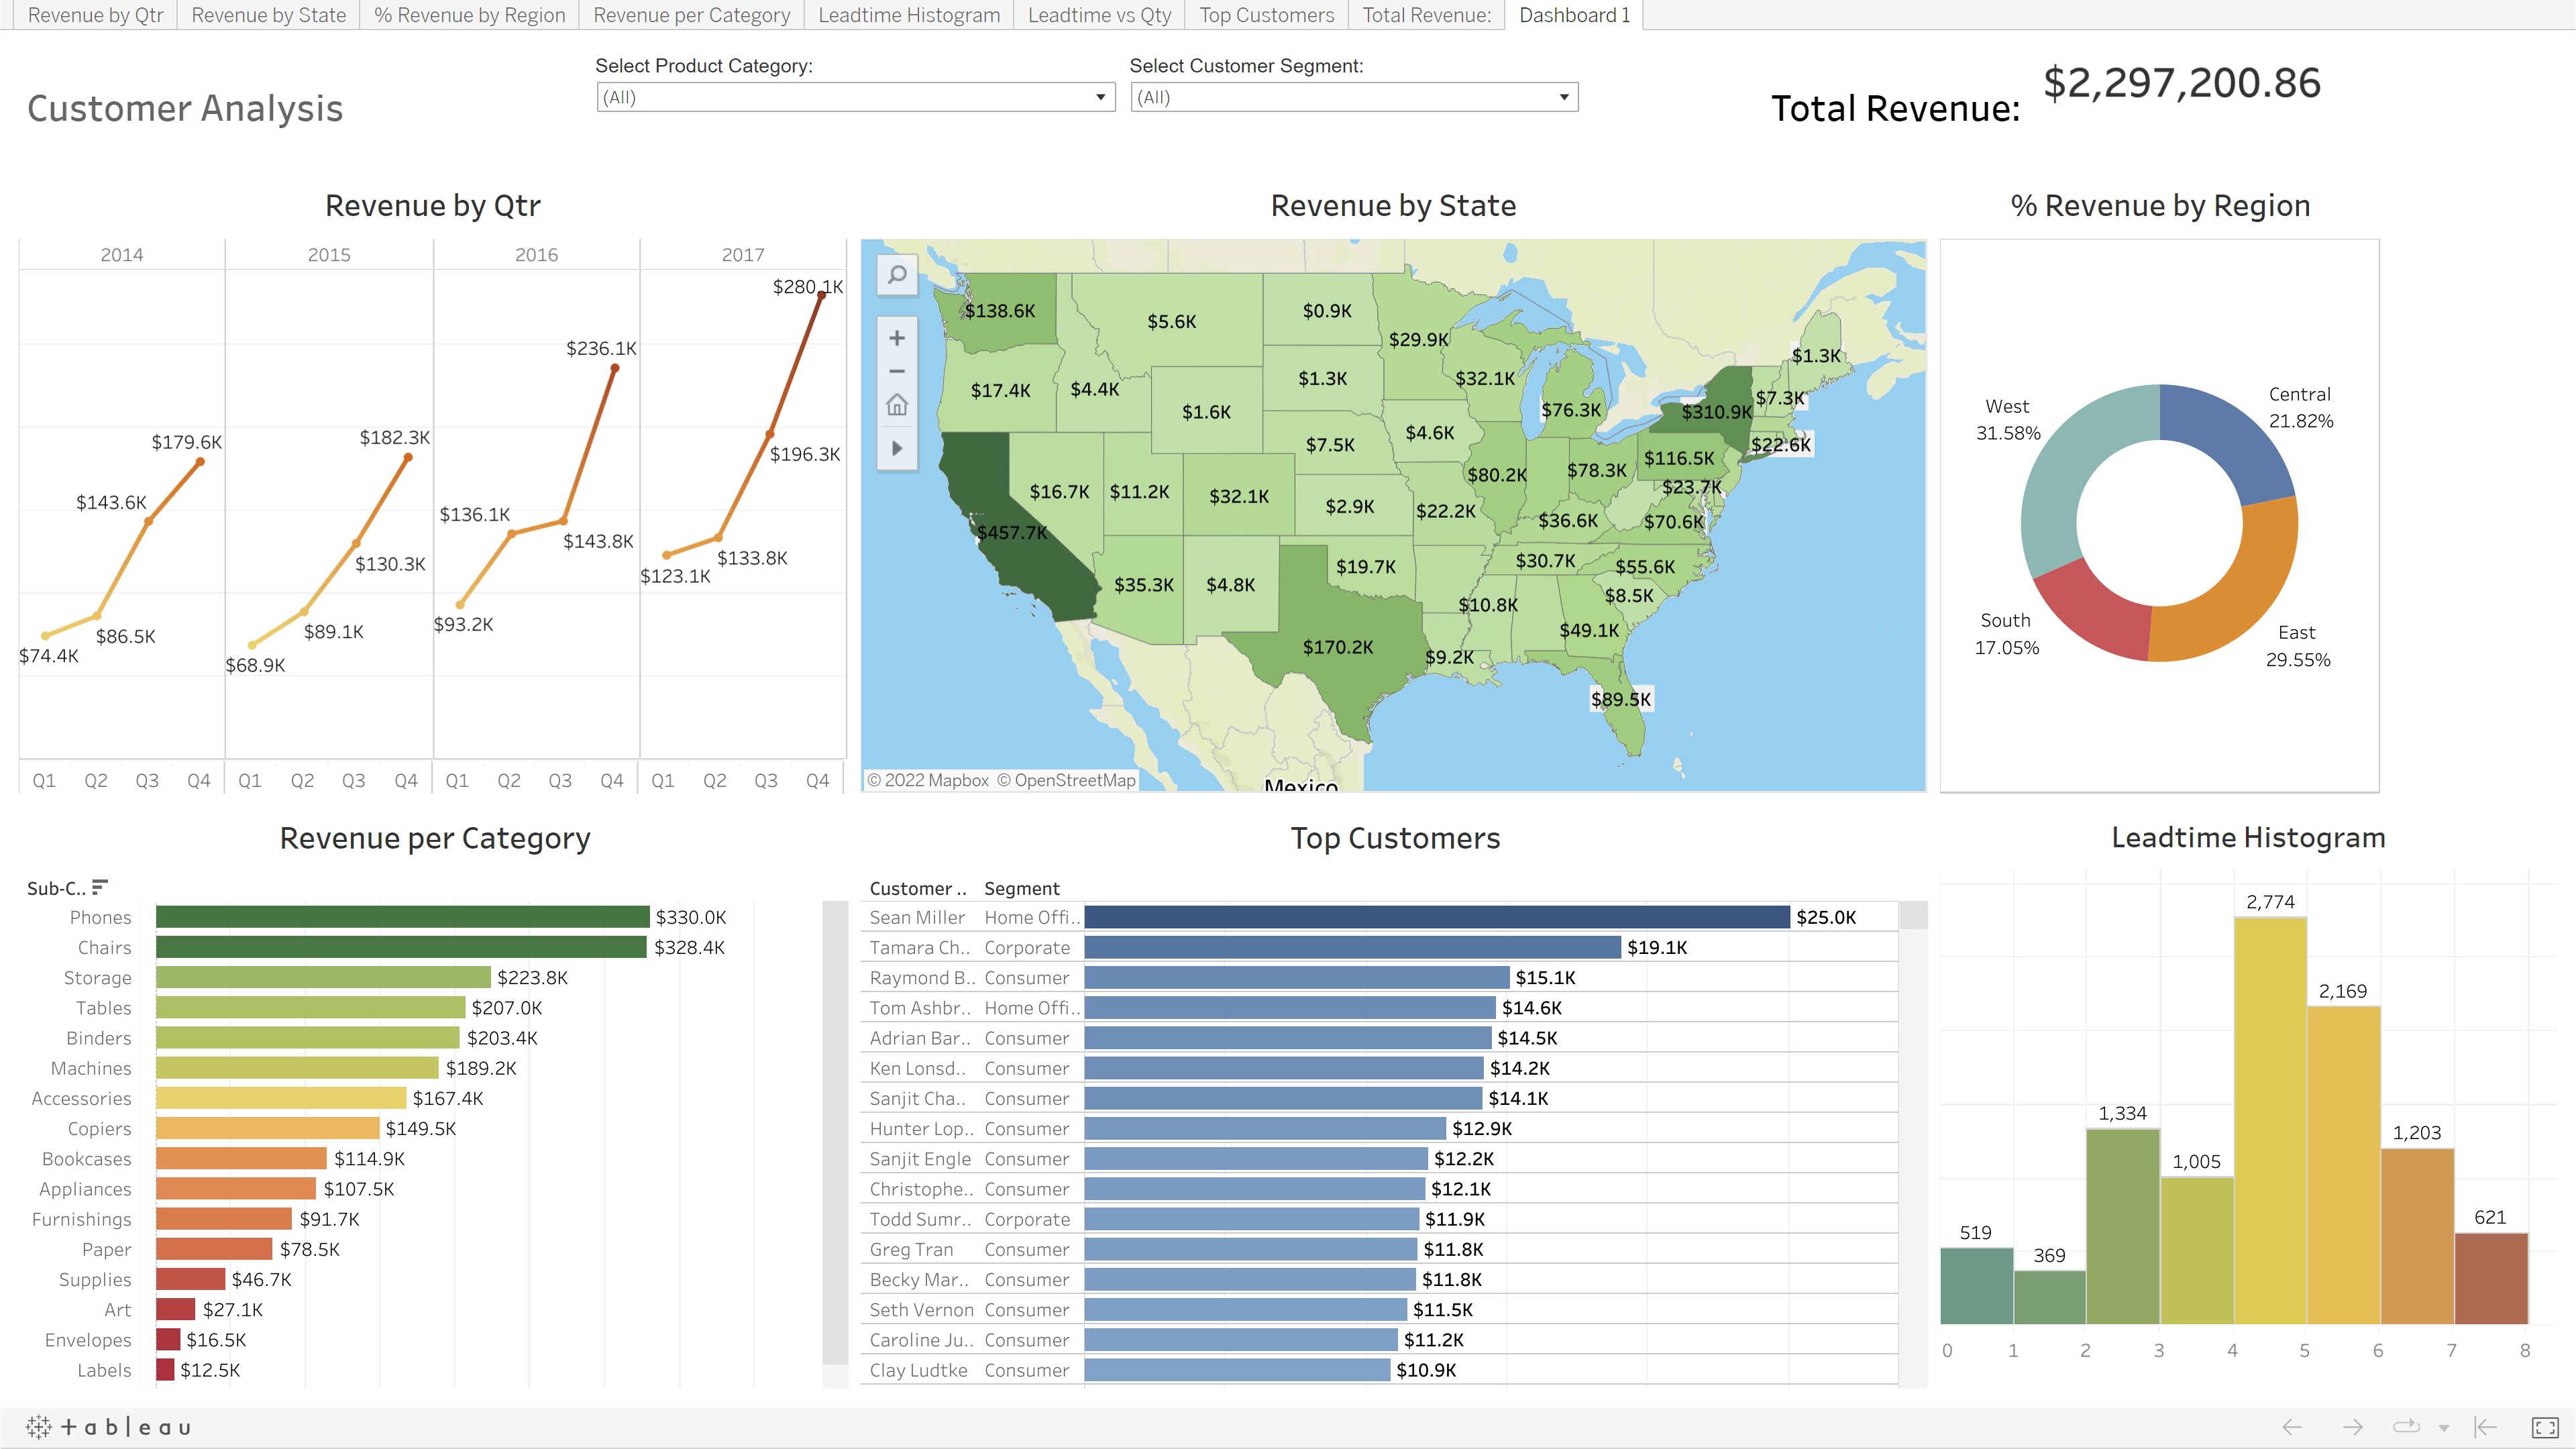
Customer Analysis Dashboard in Tableau
Customer Analysis dashboard using fictional superstore sales data. Each tile is customised to act as a filter, which enables drilling down into the data specific to the item selected on the dashboard. Please feel free to access the chart and explore how these kinds of dashboards can optimize your reporting.
Mobile Game Revenue Analysis using MS Excel & Tableau
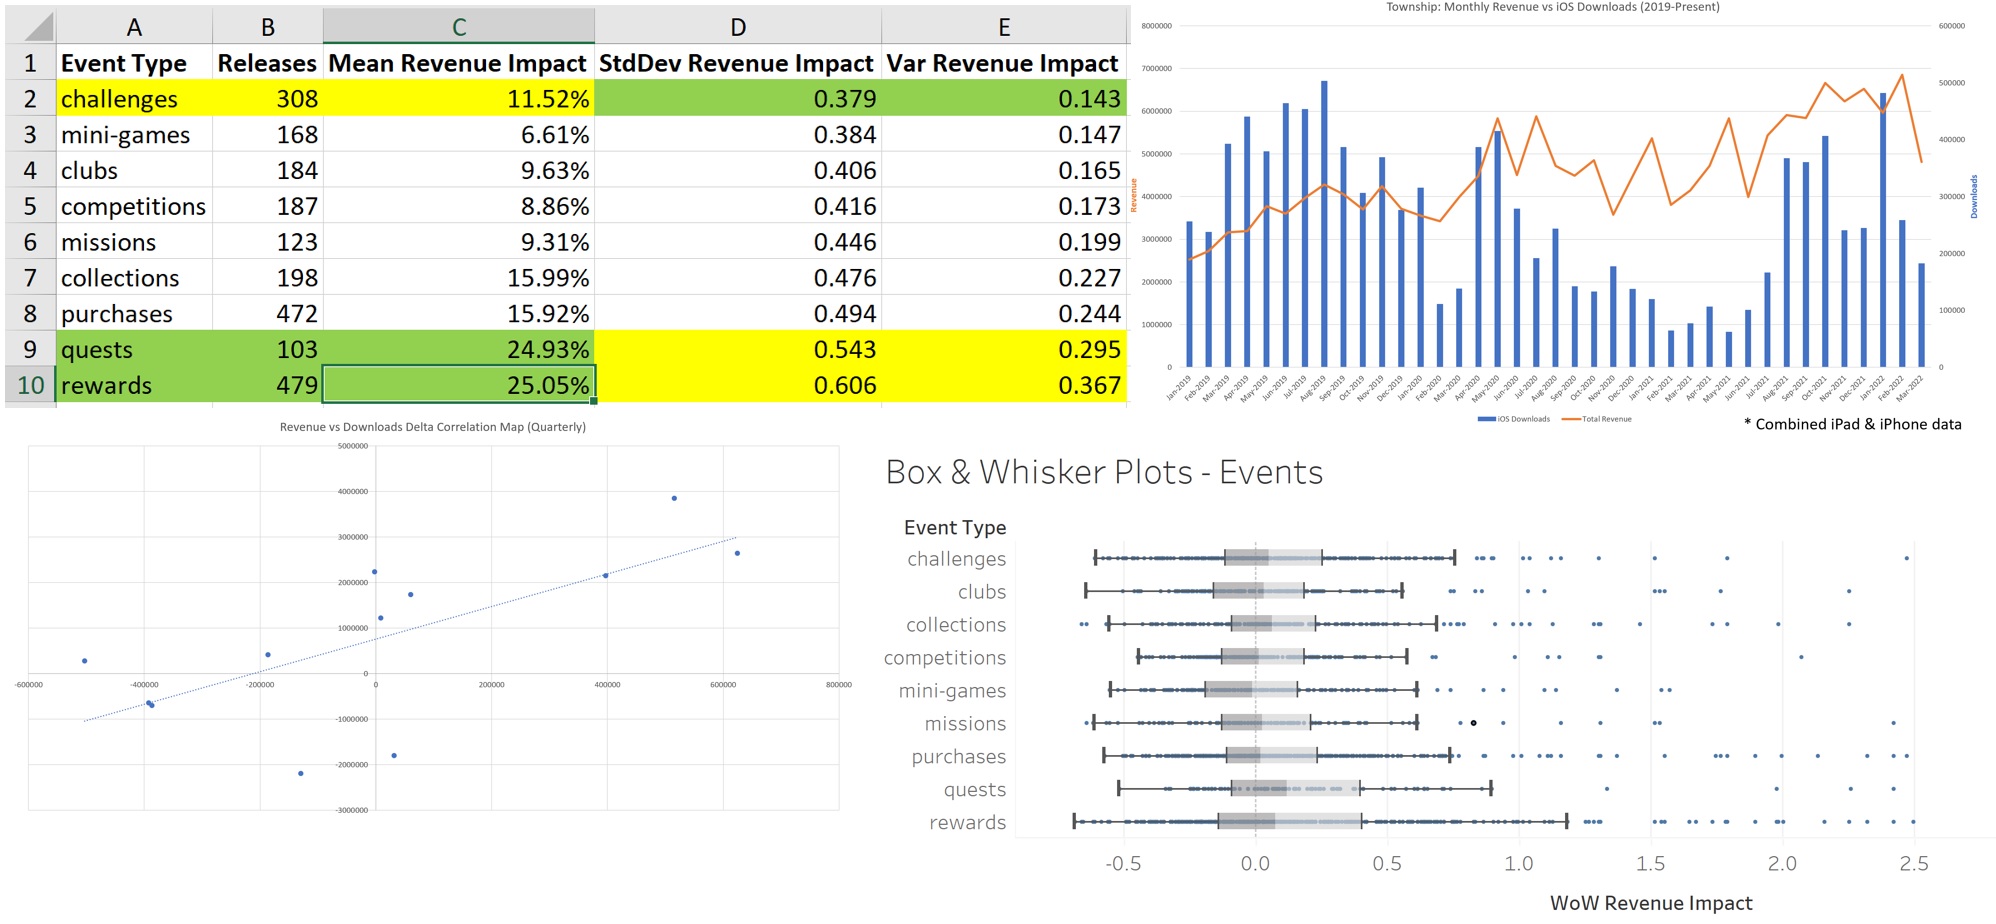
Used MS Excel & Tableau to understand the relationship between downloads & revenue of a popular mobile game, and looked into which of the game event types has the most impact on revenue growth.
Bike Sharing Data Analysis Case Study using R
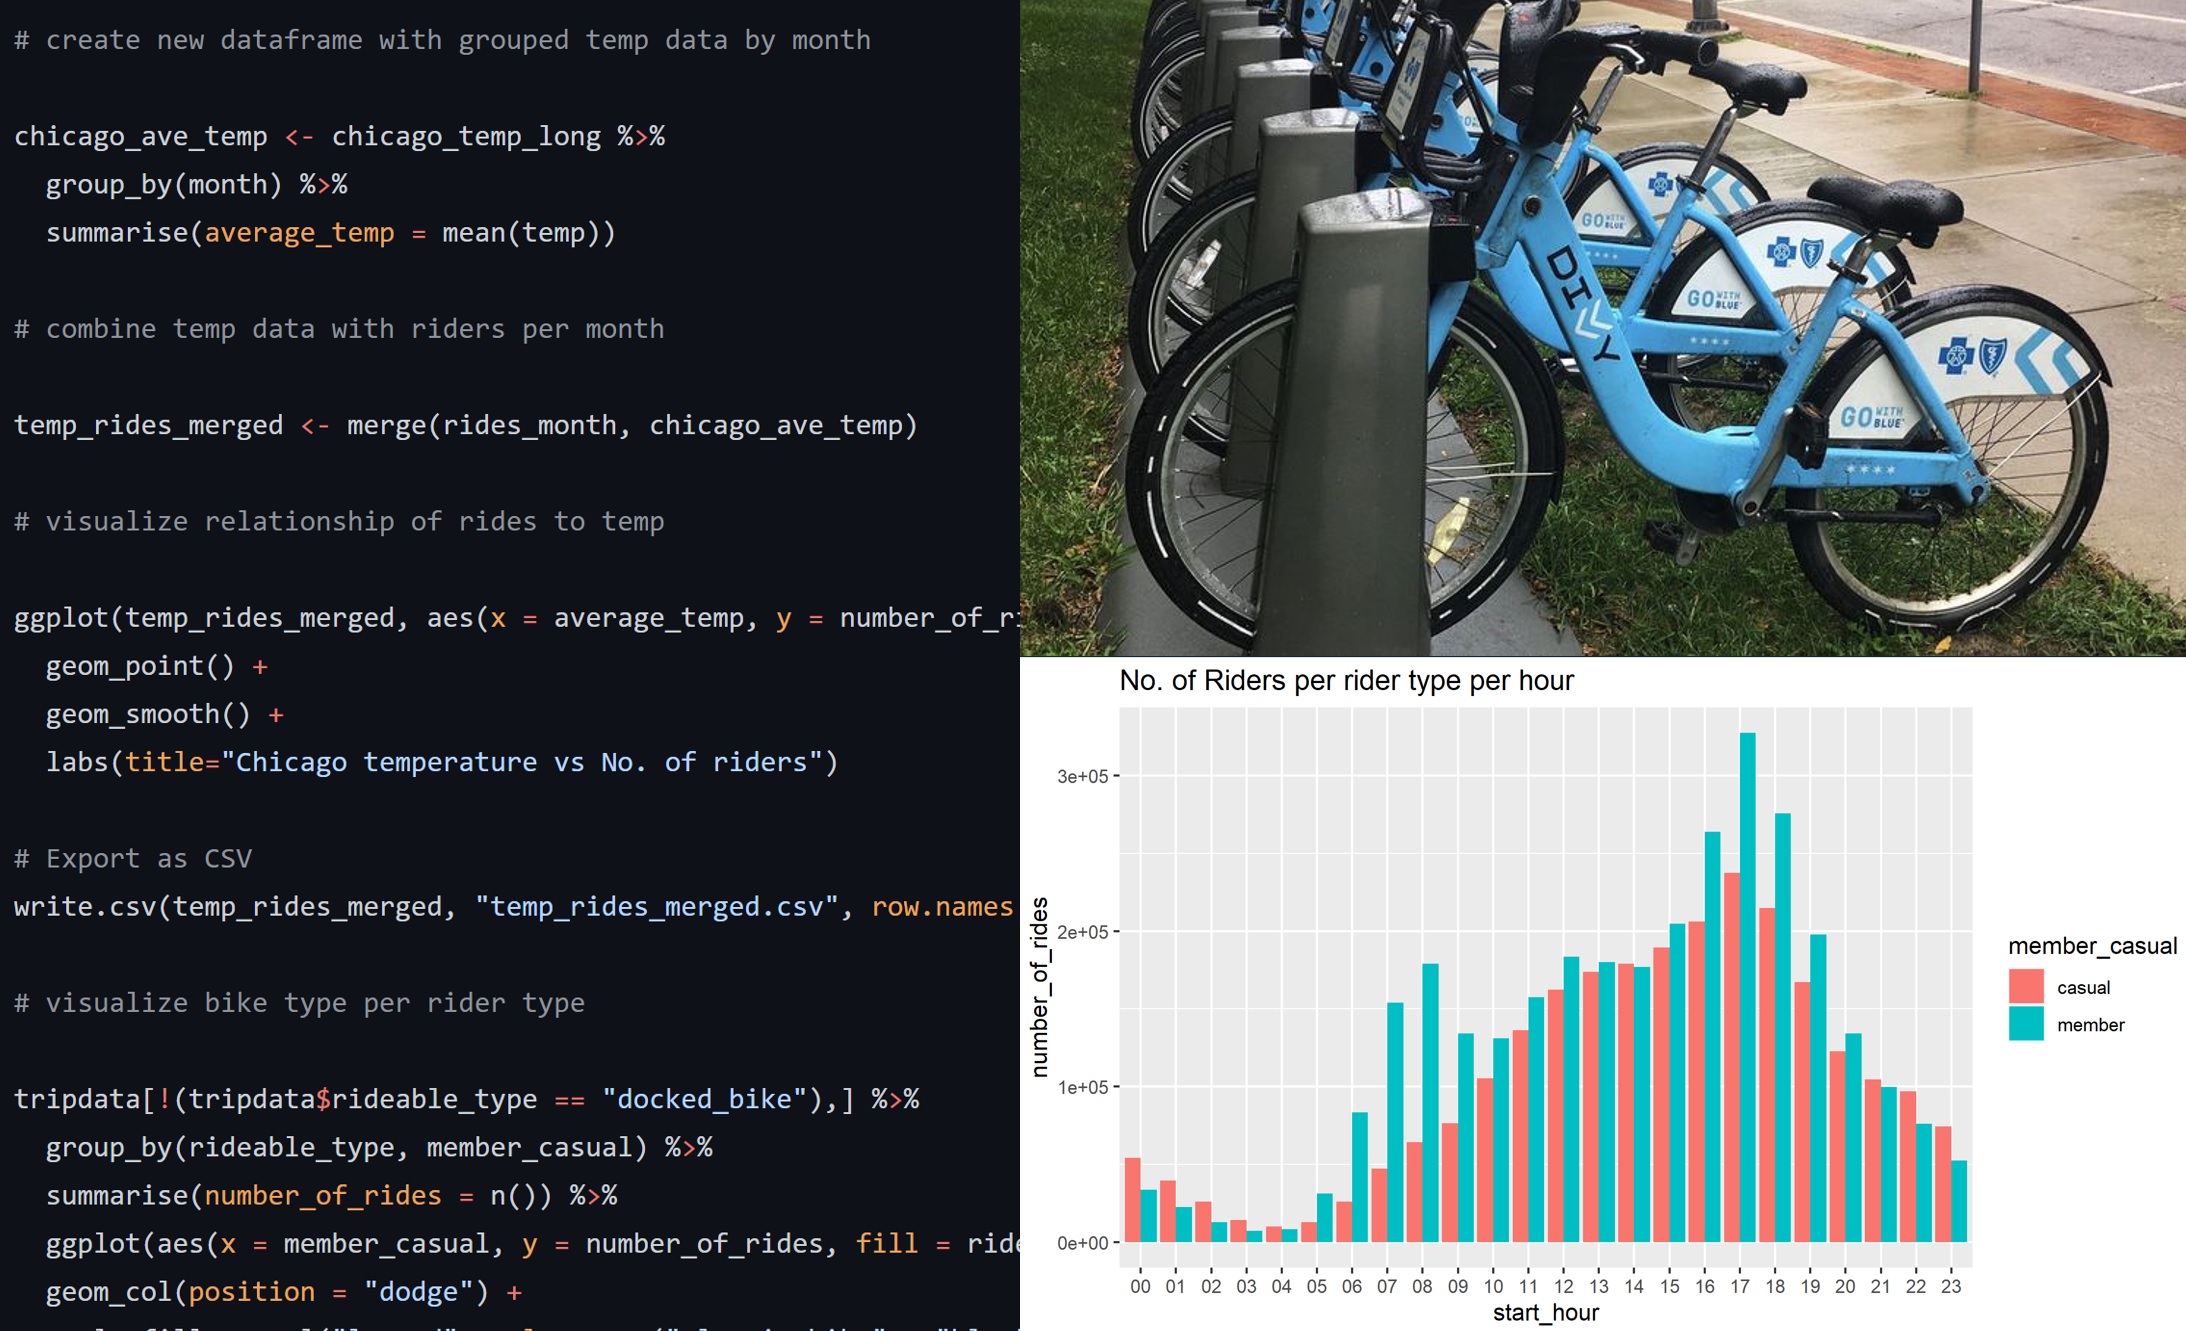
This was my Google Data Analytics Professional Course capstone project. I used R programming to get insights from 5M+ rows of publicly available data from a bike sharing company in Chicago. The goal was to help drive growth by looking into the the key differences between casual riders and annual subscribers.
Smartwatch Data Analysis Case Study in R
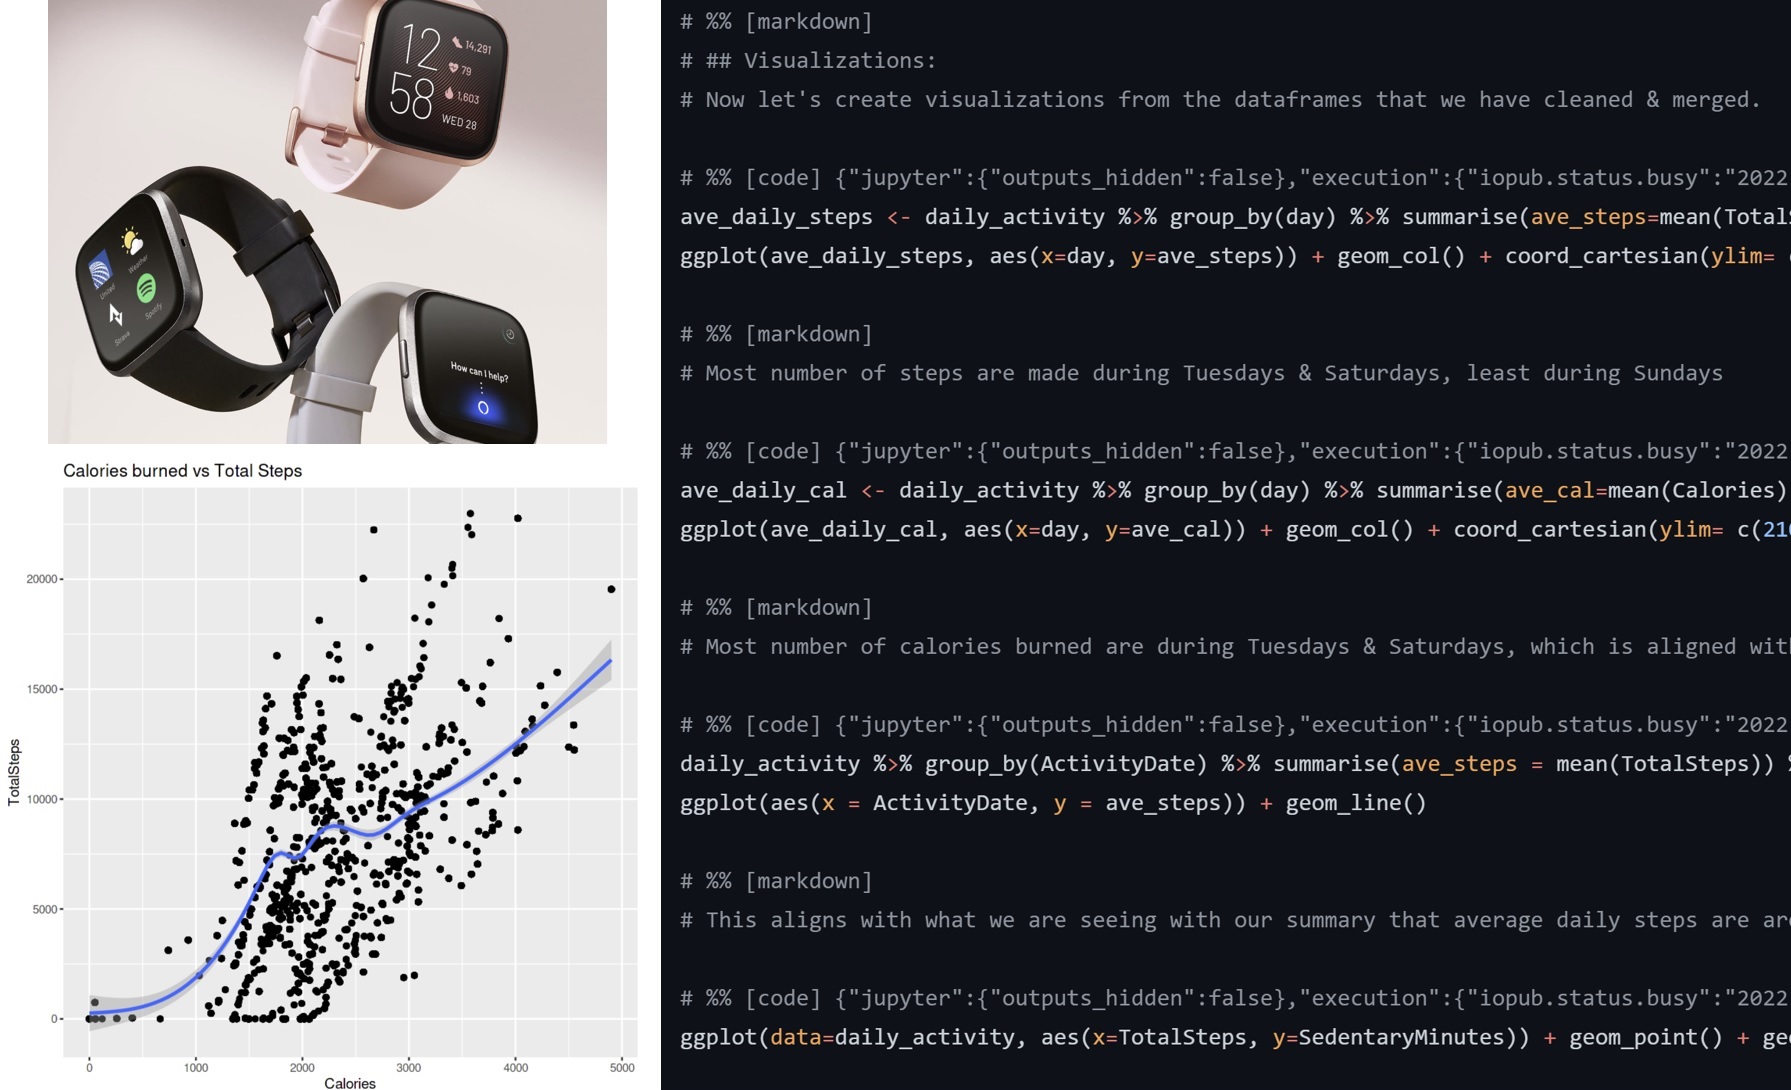
With the data gathered by fitness tracking smart watches, and the analytical capabilities of R programming, I was able to use insights from the data to generate possible additional features, with the aim of increasing sales for future products.
Sales Analysis & Forecasting in Python
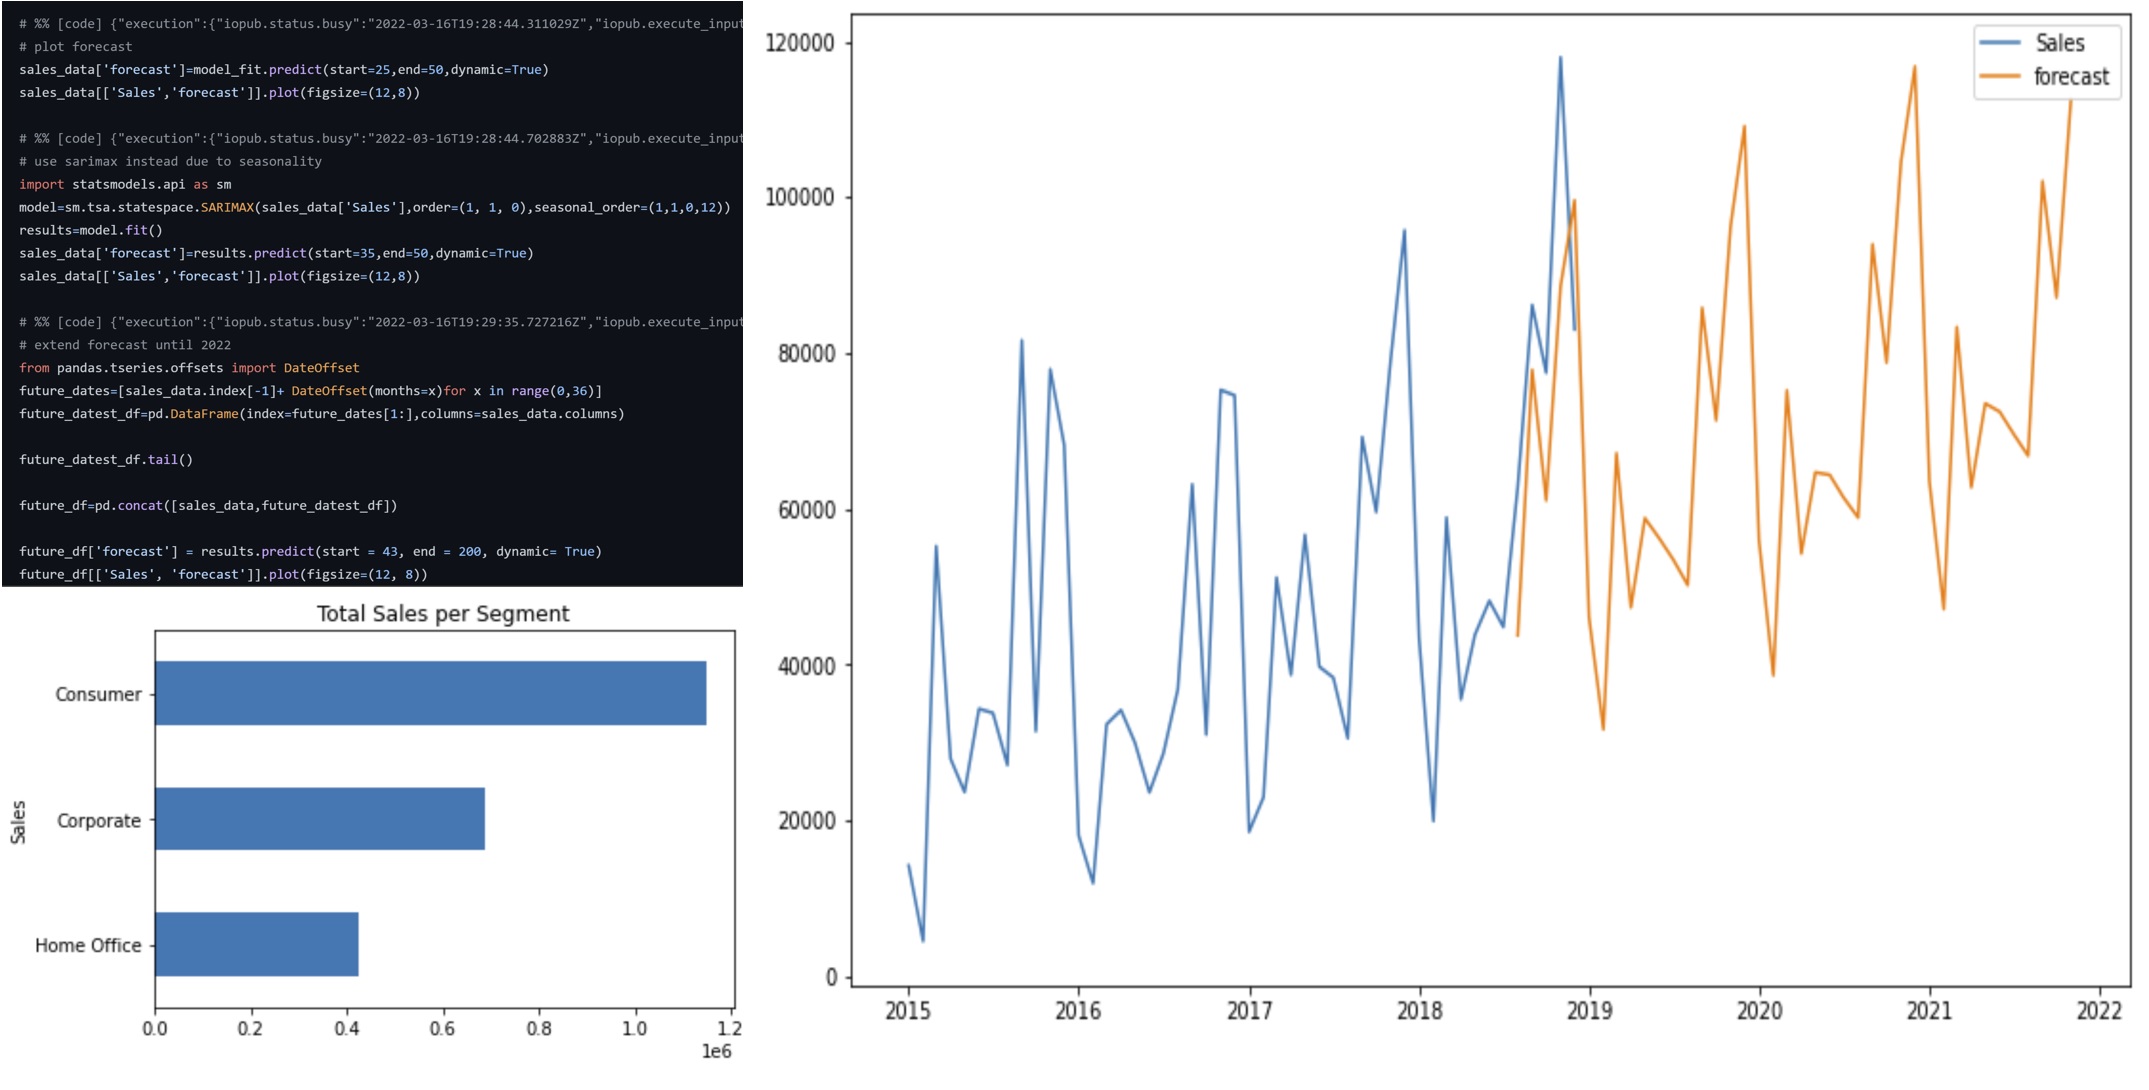
Used Python to generate visualizations for sales analysis and forecasting using publicly available superstore sales data in Kaggle
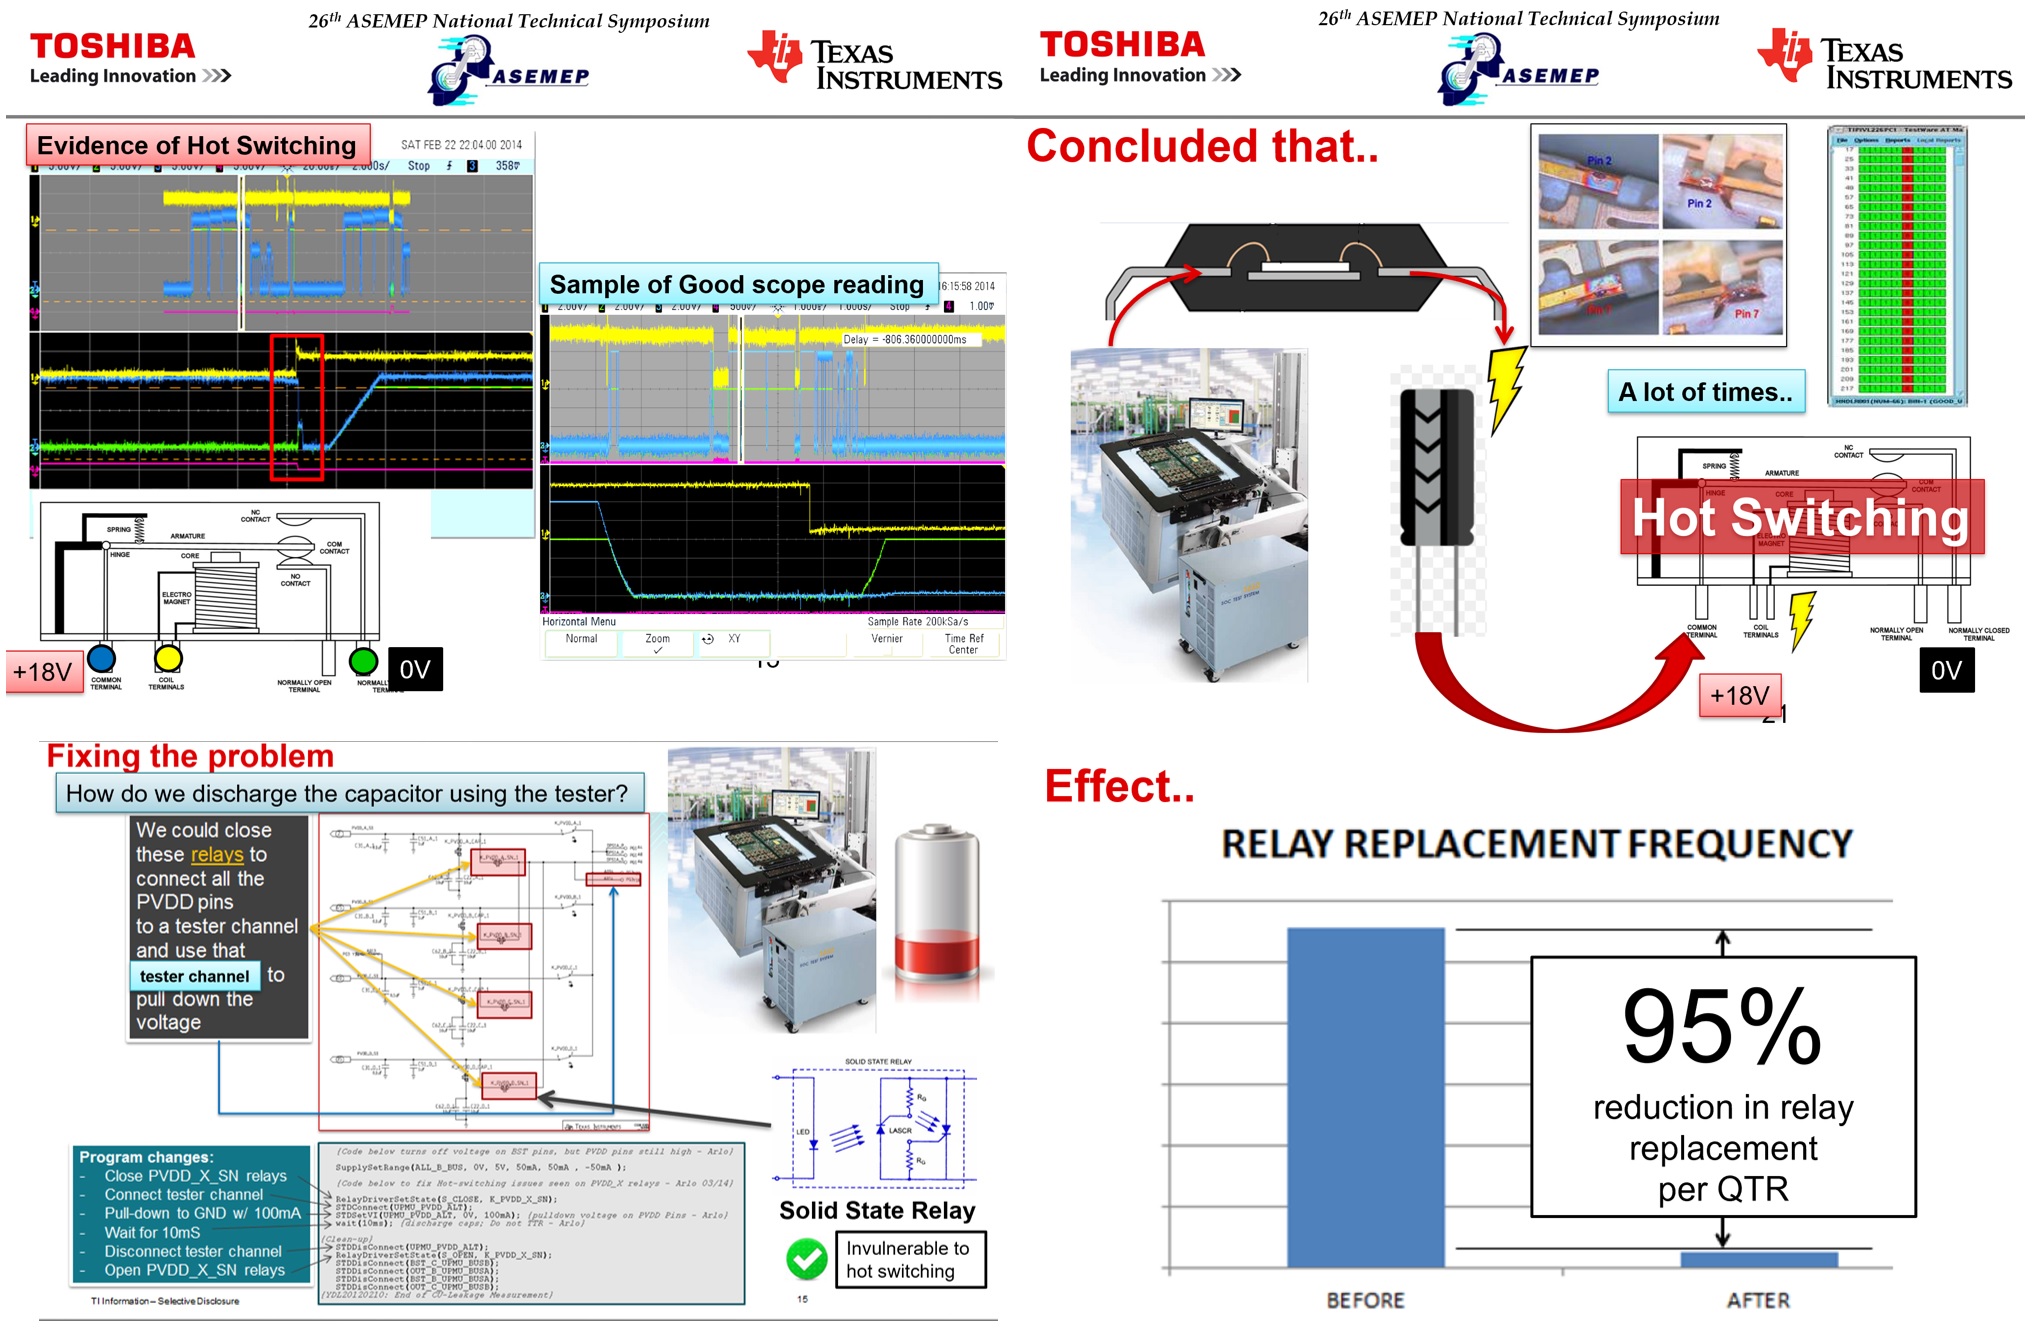
Solving hidden Hot Switching issues
A deep dive into how hidden hot switching issues from testing digital amplifiers were identified using signal analysis, and how it was solved by utilizing solid state relays to re-route testing lines. Awards: TI Phils. 2015 Technical Symposium Champion, 2016 Philippine Semiconductor National Technical Symposium Best Paper in Test Manufacturing Track & Best Presenter.